Go directly to the Citations & citation databases subject guide if you would like to learn more on this topic.
Types of Altmetrics
The difference between altmetrics and traditional, citation-based metrics is the communication channels in which the references to research outputs occur. For traditional metrics these references occur in publications that are tracked by citation databases (articles, reviews, conference proceedings papers and books). For Altmetrics this is very broad, and can involve any online communication channel with items that refer to research outputs. Altmetrics consist of metrics as well as underlying qualitative data that are complementary to traditional, citation-based metrics. They can include, but are not limited to:
- post-peer reviews
- citations on Wikipedia, or
- the number of downloads or views
- uptake in personal Mendeley libraries
- mentions on Twitter and Facebook
- mentions in selected blogs
- mentions in news outlets
- mentions in (inter)governmental policy documents
- citations in patents
- mentions in YouTube video descriptions
Altmetrics are not a single class of indicators, but they can provide interesting information about a publication’s online uptake, sharing and impact that citations alone cannot provide. Usually, Altmetric data is available faster than citation based measures, as downloads or online mentions can occur immediately upon online publication.
Keep in mind that metrics (including citation-based metrics) are merely indicators – they can point to interesting spikes in different types of attention – but are not themselves evidence of such. For the evidence, one has to look at the underlying qualitative data: who is saying what about a research output, through which channels and where in the world.
Why use altmetrics?
Not only peers read your online research output but many others as well. One can uncover what these other groups say about your outputs with the underlying qualitative data. The qualitative data also contains demographic and geographic information on people and institutes who are mentioning your output. This information might reveal that your output is not only discussed by peers, but also by students, professionals, practitioners, journalists, institutes, or patient associations, indicating the social or educational relevance of your output.
Views and downloads (a special brand of altmetrics) and their drawbacks
Views and downloads are also indicators in the ‘usage’ category and these data are normally also available long before articles or book (chapters) receive their first citation. However, these two metrics are no genuine indicators of use, but potential indicators of use, or indicators for the level of interest.
The sources for these usage statistics are manifold and consist of two main groups:
- Views and downloads from digital libraries, journals, online databases, and institutional websites.
- Views and downloads in scholarly social websites, such as Academia.edu, ResearchGate.net, Mendeley and other social reference sharing sites like Zotero.
Views
Views, as an alternative metric that measures the interest level in an item, or as an early indicator of its future impact, were introduced because they:[1]
- Start to accumulate as soon as an output is available online.
- Reflect the interest of the whole research community, including undergraduate and graduate students, and researchers operating in the corporate sector, who tend not to publish and cite and who are “hidden” from citation-based metrics.
- They can help to demonstrate the impact of research that is published with the expectation of being read rather than extensively cited, such as clinical and arts and humanities research.
In Scopus views are called ‘Views Count’ and in the Web of Science ‘Usage Count’, and both are calculated slightly different.
PlumX tracks views on Mendeley Data, Dryad, Figshare, and Slideshare. Altmetrics Explorer???
Downloads
The interest in downloads stems from the belief that they predict later citations in the sense that more downloaded articles tend to become more cited. However, downloads – from any of the platforms – do not measure the same as citations, and not all downloaded articles are read.
Publication usage statistics are usually freely available on social websites and typically found by searching the site in question for relevant articles and then identifying statistics about the article from its page within the site. Many journal websites and institutional websites or repositories, like Pure, also present download numbers. A drawback of usage indicators derived from social websites is that many scholars do not use them, many scholars using these tools do not register all of their publications in them, and many of them do not provide the full-text of the publications for others to access.
[1] See Elsevier: SciVal Metric: Views Count
Drawbacks
Besides being very easy to manipulate, the main limitation of view and download metrics is that most are anonymized, or only visible on one’s own profile that is not publicly available, as in ResearchGate. Most do not provide any information about what users of a particular institution or country are viewing or downloading, and it is not possible to see the usage of a particular user.
Nevertheless, when metrics on views or downloads are needed, for example for datasets that lack citations but uploaded to Zenodo, FighShare or other platforms, try to find a benchmark in similar datasets (content and size wise) and compare your views or downloads against those.
Mendeley reader counts
An exception to (a complete) anonymization of usage data is Mendeley, as it provides aggregated user supplied demographic, geographical, and disciplinary background information about readers that have added a publication to the users’ library in the tool. Moreover, Mendeley readership counts, for the life and natural sciences, correlate significantly with citation counts in the Web of Science, Scopus and Google Scholar. A more recent study shows that Mendeley reader counts can also be used as an early citation impact indicator in the arts and humanities, although it is unclear whether reader or citation counts reflect the underlying value of arts and humanities research.[1]
Instead of searching Mendeley itself, one can also use PlumX or Altmetric, or other altmetric access points to look for the Mendeley reader counts of an output.
[1] See: Thelwall, M. (2019). Do Mendeley reader counts indicate the value of arts and humanities research? Journal of Librarianship and Information Science, 51(3), 781–788. https://doi.org/10.1177/0961000617732381
Main Altmetric Sources
The two main altmetric data aggregators are Altmetric.com and PlumX Analytics, recognizable by the Altmetric donut and the Plum Print.


These platforms differ in the way they source and report metrics.
PlumX
- About Artifacts (For a comprehensive list of artifacts gathered)
- Full list of PlumX metrics
Almetric.com
- “Not just science articles- tracking other disciplines and other research outputs” (Altmetric blog provides information of data curation in their post)
- Tracking and collating attention
- Altmetric’s Sources of Attention
- Sources of Attention (more detailed documentation)
- The donut and score
- Altmetric.com bookmarklet (free use)
Access points for the main altmetrics providers on a research output
PlumX: Research Information Portal, Scopus, Journal websites (publisher dependent)
Altmetrics.com: Research Information Portal, Dimensions, Journal websites (publisher dependent), Altmetric Explorer – Via UL database list
The advantage of using Altmetric Explorer
The advantage of using Altmetric Explorer is that one can export counts of the mentions for each research output to excel or via the API. You can also create custom reports and register to receive regular email alerts and updates to stay up-to-date with the latest activity. Another advantage compared to other access points is that Twitter activity is not restricted to the last 7 days.
Getting started with Altmetric Explorer
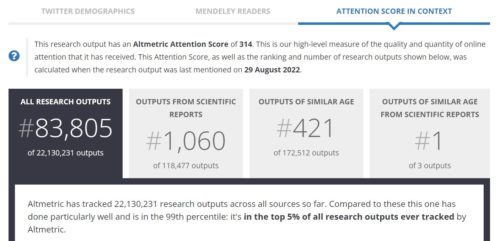
Before you get started with Altmetric Explorer, be aware that the Altmetric Attention Score, shown in the donuts, and the Attention Score in Context (found on Altmetric details pages) should never be used as such, as it is a composite indicator.
The Attention Score can be used to navigate to outputs with a lot of attention, worthwhile to investigate further, and is best used by individual researchers to understand the overall volume of attention that research has received online.
To understand how a research output’s score compares to other scores use the “Score in Context” tab (found on Altmetric details pages). The Score in context shows rankings and a percentile, based on a comparison of the score of an output with the scores of articles in the same journal, with all articles of a similar age, with other articles of a similar age in the same journal, and with all articles tracked by Altmetric.

However, the Score in context is based on the Attention Score which is a complex indicator not to use, and the journal-based ranks go against DORA. We therefore advise you to not use the Attention Score in context.
Get started
- Find altmetrics for your publication
- Altmetric mentions in patents and policy documents
- The value and limitations of Altmetric.com
- Altmetric for Researchers (tips and tutorials for researchers).
- The introductory video on Altmetric Explorer.
